Migrating from Kubernetes Deployment to Knative Serving

When I talk about Knative, I often get questions on how to migrate an app from Kubernetes Deployment (sometimes with Istio) to Knative and what are the differences between the two setups.

First of all, everything you can do with a Knative Service, you can probably do with a pure Kubernetes + Istio setup and the right configuration. However, it’ll be much harder to get right. The whole point of Knative is to simplify and abstract away the details of Kubernetes and Istio for you.

In this blog post, I want to answer the question in a different way. I want to start with a Knative Service and show how to setup the same service with Kubernetes + Istio the ‘hard way’.

Knative Service

In my previous post, I showed how to deploy an autoscaled, gRPC enabled, ASP.NET Core service with Knative. This was the Knative service definition yaml file:

apiVersion: serving.knative.dev/v1beta1
kind: Service
metadata:
  name: grpc-greeter
  namespace: default
spec:
  template:
    spec:
      containers:
        - image: docker.io/meteatamel/grpc-greeter:v1
          ports:
          - name: h2c
            containerPort: 8080

Notice the simplicity of the yaml file. It had the container image and the port info (HTTP2/8080) and not much else. Once deployed, Knative Serving took care of all the details of deploying the container in a Kubernetes pod, exposing that pod to the outside world via Istio ingress and also setting up autoscaling.

What does it take to deploy the same service in a Kubernetes + Istio cluster without Knative? Let’s take a look.

Kubernetes Deployment

First, we need a Kubernetes Deployment to encapsulate the container in a pod. This is how the deployment yaml looks like:

apiVersion: apps/v1
kind: Deployment
metadata:
  name: grpc-greeter
spec:
  selector:
      matchLabels:
        app: grpc-greeter
  template:
    metadata:
      labels:
        app: grpc-greeter
    spec:
      containers:
      - name: grpc-greeter
        image: docker.io/meteatamel/grpc-greeter:v1
        ports:
        - name: h2c
          containerPort: 8080

This is already more verbose than a Knative service definition. Once deployed, we’ll have a pod running the container.

Kubernetes Service

Next step is to expose the pod behind a Kubernetes Service:

apiVersion: v1
kind: Service
metadata:
  name: grpc-greeter-service
spec:
  ports:
  - name: http2
    port: 80
    targetPort: h2c
  selector:
    app: grpc-greeter

This will expose the pod behind port 80. However, it’s not publicly accessible yet until we setup networking in Istio.

Istio Gateway and VirtualService

In an Istio cluster, we need to first setup a Gateway to enable external traffic on a port/protocol. In our case, our app requires HTTP on port 80. This is the Gateway definition we need:

apiVersion: networking.istio.io/v1alpha3
kind: Gateway
metadata:
  name: grpc-gateway
spec:
  selector:
    istio: ingressgateway # use istio default controller
  servers:
  - port:
      number: 80
      name: http
      protocol: HTTP
    hosts:
    - "*"

We now have traffic enabled on port 80 but we need to map the traffic to the Kubernetes Service we created earlier. That’s done via a VirtualService:

apiVersion: networking.istio.io/v1alpha3
kind: VirtualService
metadata:
  name: grpc-virtualservice
spec:
  hosts:
  - "*"
  gateways:
  - grpc-gateway
  http:
  - route:
    - destination:
        host: grpc-greeter-service

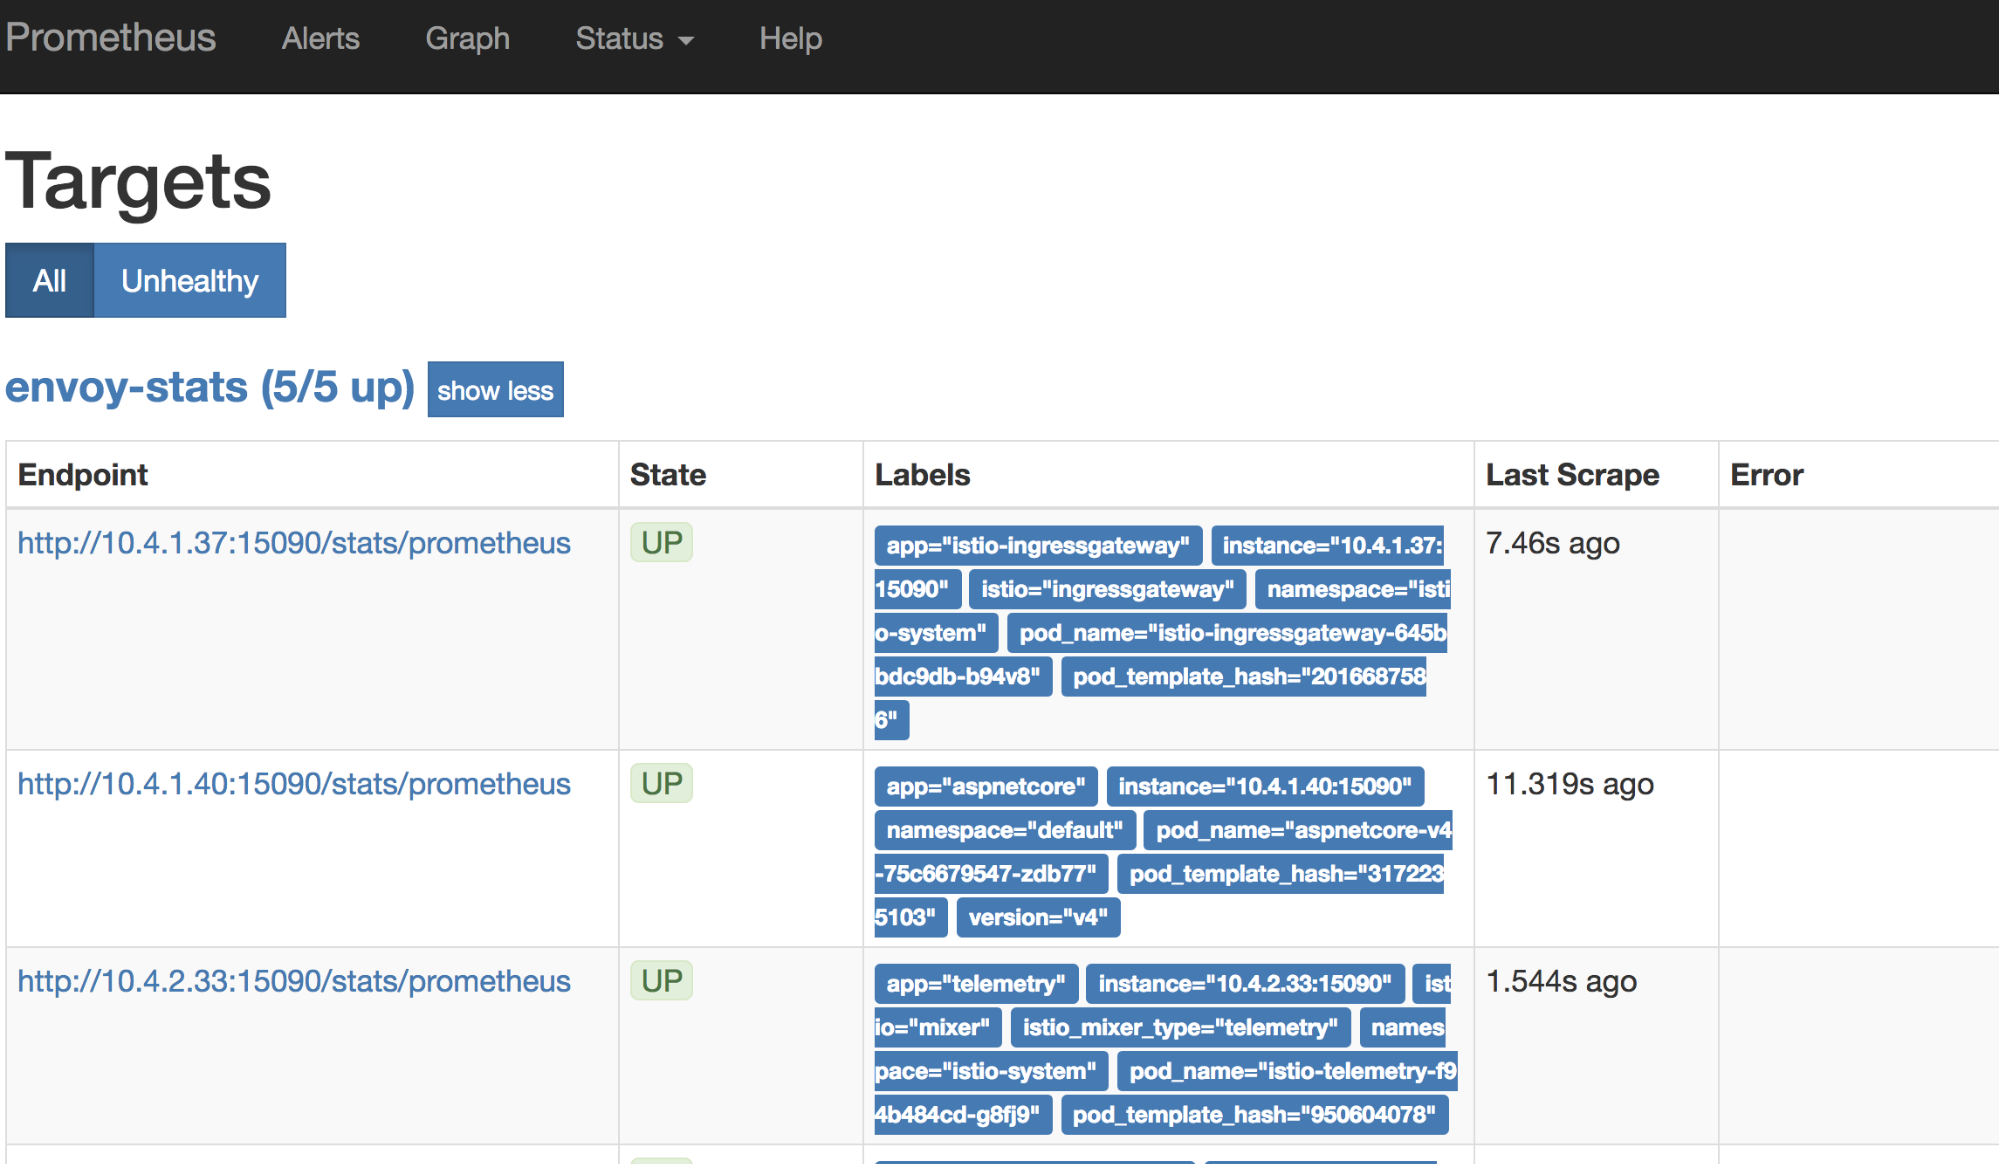
Our pod is finally publicly accessible. You can use the GrpcGreeterClient from my previous blog to point to the Istio Ingress Gateway IP and you should see a response from our service:

> dotnet run
Greeting: Hello GreeterClient
Press any key to exit…

Phew! A lot of steps to deploy a publicly accessible container without Knative. We still need to setup autoscaling of pods to get parity with Knative Serving but I’ll leave that as an exercise to the reader.

I hope it’s clear now that Knative makes it easier to deploy autoscaled containers with much less configuration. Knative’s higher level APIs allow you to focus more on your code in a container than the underlying details of how that container is deployed and how its traffic is managed with Kubernetes and Istio.

Thanks to Matt Moore from the Knative team for giving me the idea for the blog post.

Application metrics in Istio

Background

The default metrics sent by Istio are useful to get an idea on how the traffic flows in your cluster. However, to understand how your application behaves, you also need application metrics.

Prometheus has client libraries that you can use to instrument your application and send those metrics. This is good but it raises some questions:

  • Where do you collect those metrics?
  • Do you use Istio’s Prometheus or set up your own Prometheus?
  • If you use Istio’s Prometheus, what configuration do you need to get those metrics scraped?

Let’s try to answer these questions.

Istio vs. standalone Prometheus

In Prometheus, there’s a federation feature that allows a Prometheus server to scrape metrics from another Prometheus server. If you want to keep Istio metrics and application metrics separate, you can set up a separate Prometheus server for application metrics. Then, you can use federation to scrape those application metrics scraped with Istio’s Prometheus server.

A simpler approach is to scrape the application’s metrics using Istio’s Prometheus directly and that’s what I want to focus on here.

Sending application metrics

To send custom metrics from your application, you need to instrument your application using Prometheus’ client libraries. Which library to use depends on the language you’re using. As a C#/.NET developer, I used the .NET client for Prometheus and this blog post from Daniel Oliver has step-by-step instructions on how to send custom metrics from an ASP.NET Core application and see them in a local Prometheus server.

One thing you need to pay attention to is the port where you’re exposing your Prometheus metrics. In ASP.NETCore, the default port is 5000. When running locally, application metrics are exposed on localhost:5000/metrics. However, when you containerize your app, it’s common to expose your application over a different port, like 8080, and this becomes relevant later when we talk about configuration.

Assuming that you containerized and deployed your application on an Istio-enabled Kubernetes cluster, let’s now take a look at what we need to do to get these application metrics scraped by Istio’s Prometheus.

Configuration

In Istio 1.0.5, the default installation files for Kubernetes, istio-demo.yaml or istio-demo-auth.yaml, already have scraping configurations for Prometheus under a ConfigMap. You can just search for prometheus.yml. There are 2 scraping jobs that are relevant for application metrics:

- job_name: 'kubernetes-pods'
  kubernetes_sd_configs:
- role: pod
...
- job_name: 'kubernetes-pods-istio-secure' 
  scheme: https

These are the jobs that scrape metrics from regular pods and pods where mTLS is enabled. It looks like Istio’s Prometheus should automatically scrape application metrics. However, in my first try, it didn’t work. I wasn’t sure what was wrong but Prometheus has some default endpoints:

  • /config: to see the current configuration of Prometheus.
  • /metrics: to see the scraped metrics.
  • /targets: to see the targets that’s being scraped and their status.

All of these endpoints are useful for debugging Prometheus:

image1

Turns out, I needed to add some annotations in my pod YAML files in order to get Prometheus scrape the pod. I had to tell Prometheus to scrape the pod and on which port with these annotations:

kind: Deployment
metadata:
  name: aspnetcore-v4
spec:
  replicas: 1
  template:
    metadata:
      labels:
        app: aspnetcore
        version: v4
      annotations:
        prometheus.io/scrape: "true"
        prometheus.io/port: "8080"

After adding the annotations, I was able to see my application’s metrics in Prometheus:

image2

However, it was only working for regular pods and I was not able to see metrics with mTLS enabled between pods.

Issue with Istio certs and Prometheus

After some investigation, I contacted the Istio team and turns out, there’s a bug. When Prometheus starts, it will attempt to mount the Istio-supplied certificates. However, they may not have been issued by Istio Citadel yet. Unfortunately, Prometheus does not retry to load the certificates, which leads to an issue scraping mTLS-protected endpoints.

It’s not ideal but there’s an easy workaround: restart the Prometheus pod. Restart forces Prometheus to pick up certificates and the application’s metrics start flowing for mTLS enabled pods as well.

Conclusion

Getting application metrics scraped by Istio’s Prometheus is pretty straightforward once you understand the basics. Hopefully, this post provided you the background info and configuration you need to achieve that.

It’s worth noting that Mixer is being redesigned and, in future versions of Istio, it will be directly embedded in Envoy. In that design, you’ll be able to send application metrics through Mixer and it’ll flow through the same overall metrics pipeline of the sidecar. This should make it simpler to get application metrics working end to end.

Thanks to the Istio team and my coworker Sandeep Dinesh for helping me to debug through issues, as I got things working.

Istio 101 (1.0) on GKE

Istio 1.0 is finally announced! In this post, I updated my previous Istio 101 post with Istio 1.0 specific instructions. Most of the instructions are the same but with a few minor differences about where things live (folder names/locations changed) and also most commands now default to kubectl instead of istioctl.

For those of you who haven’t read my Istio 101 post, I show how to install Istio 1.0 on Google Kubernetes Engine (GKE), deploy the sample BookInfo app and show some of the add-ons and traffic routing.

Create Kubernetes cluster

First, we need a Kubernetes cluster to install Istio. On GKE, this is a single command:

gcloud container clusters create hello-istio \
 --cluster-version=latest \
 --zone europe-west1-b \
 --num-nodes 4

I’m using 4 worker nodes. That’s the recommended number of nodes for BookInfo sample.

Once the cluster is created, we also need to create a clusterrolebinding for Istio to be able to manage the cluster:

kubectl create clusterrolebinding cluster-admin-binding \
 --clusterrole=cluster-admin \
 --user=$(gcloud config get-value core/account)

Download & Setup Istio

Now that we have a cluster, let’s download the latest Istio (1.0.0 as of today):

curl -L https://git.io/getLatestIstio | ISTIO_VERSION=1.0.0 sh -

Add Istio’s command line tool istioctl to your PATH. We’ll need it later:

export PATH="$PATH:./istio-1.0.0/bin"

Install Istio

It’s time to install Istio with mutual authentication between sidecars:

kubectl apply -f install/kubernetes/istio-demo-auth.yaml

Once it’s done, you can check that pods are running under istio-system namespace:

kubectl get pods -n istio-system

You’ll realize that in addition to Istio base components (eg. pilot, mixer, ingress, egress), a number of add-ons are also installed (eg. prometheus, servicegraph, grafana). This is different from the previous versions of Istio.

Enable sidecar injection

When we configure and run the services, Envoy sidecars can be automatically injected into each pod for the service. For that to work, we need to enable sidecar injection for the namespace (‘default’) that we will use for our microservices. We do that by applying a label:

kubectl label namespace default istio-injection=enabled

And verify that label was successfully applied:

kubectl get namespace -L istio-injection

Deploy BookInfo app

Let’s deploy the BookInfo sample app now:

kubectl apply -f samples/bookinfo/platform/kube/bookinfo.yaml

And make sure all the pods are running. Notice that there are 2 pods for each service (1 the actual service and 1 sidecar):

kubectl get pods

Deploy BookInfo Gateway

In Istio 1.0.0, you need to create a gateway for ingress traffic. Let’s go ahead and create a gateway for BookInfo app:

kubectl apply -f samples/bookinfo/networking/bookinfo-gateway.yaml

Use BookInfo app

We can finally take a look at the app. We need to find ingress gateway IP and port:

kubectl get svc istio-ingressgateway -n istio-system

To make it easier for us, let’s define a GATEWAY_URL variable:

export INGRESS_HOST=$(kubectl -n istio-system get service istio-ingressgateway -o jsonpath='{.status.loadBalancer.ingress[0].ip}')
export INGRESS_PORT=$(kubectl -n istio-system get service istio-ingressgateway -o jsonpath='{.spec.ports[?(@.name=="http2")].port}')
export GATEWAY_URL=$INGRESS_HOST:$INGRESS_PORT

Let’s see if the app is working. You should get 200 with curl:

curl -o /dev/null -s -w "%{http_code}\n" http://${GATEWAY_URL}/productpage

You can also open a browser and see the web frontend for product page. At this point, we got the app deployed and managed by a basic installation of Istio.

Next, we’ll take a look at some of the add-ons. Unlike previous versions, add-ons are automatically installed already. Let’s start sending some traffic first:

for i in {1..100}; do curl -o /dev/null -s -w "%{http_code}\n" http://${GATEWAY_URL}/productpage; done

Grafana dashboard

There’s Grafana for dashboarding. Let’s setup port forwarding first:

kubectl -n istio-system port-forward $(kubectl -n istio-system get pod -l app=grafana -o jsonpath='{.items[0].metadata.name}') 8080:3000

Navigate to http://localhost:8080 to see the dashboard:

Istio Dashboard in Grafana

Prometheus metrics

Next, let’s take a look at Prometheus for metrics. Set port forwarding:

kubectl -n istio-system port-forward $(kubectl -n istio-system get pod -l app=prometheus -o jsonpath='{.items[0].metadata.name}') 8083:9090

Navigate to http://localhost:8083/graph to see Prometheus:

Prometheus in Istio

ServiceGraph

For dependency visualization, we can take a look at ServiceGraph:

kubectl -n istio-system port-forward $(kubectl -n istio-system get pod -l app=servicegraph -o jsonpath='{.items[0].metadata.name}') 8082:8088

Navigate to http://localhost:8082/dotviz:

Screen Shot 2018-06-07 at 10.02.38 AM.png

Tracing

For HTTP tracing, there is Jaegar and Zipkin. Let’s take a look at Jaeger. Setup port forwarding as usual:

kubectl port-forward -n istio-system $(kubectl get pod -n istio-system -l app=jaeger -o jsonpath='{.items[0].metadata.name}') 8084:16686

Navigate to http://localhost:8084

Screen Shot 2018-06-07 at 10.05.11 AM

Traffic Management

Before you can use Istio to control the Bookinfo version routing, you need to define the available versions, called subsets, in destination rules. Run the following command to create default destination rules for the Bookinfo services:

kubectl apply -f samples/bookinfo/networking/destination-rule-all-mtls.yaml

You can then see the existing VirtualServices and DestinationRules like this:

kubectl get virtualservices -o yaml
kubectl get destinationrules -o yaml

When you go to the product page of BookInfo application and do a browser refresh a few times, you will see that the reviews section on the right keeps changing (the stars change color). This is because there are 3 different reviews microservices and everytime, a different microservice is invoked. Let’s pin all microservices to version1:

kubectl apply -f samples/bookinfo/networking/virtual-service-all-v1.yaml

This creates VirtualServices and DestinationRules needed to pin all microservices to version1. Now, if you back to the product page and do a browser refresh, nothing changes because reviews microservice is pinned to version1 now.

To pin a specific user (eg. Jason) to a specific version (v2), we can do the following:

kubectl apply -f samples/bookinfo/networking/virtual-service-reviews-test-v2.yaml

With this rule, if you login to the product page with username “Jason”, you should see the v2 version of reviews microservice.

To clean up all destination rules, run the following and now we’re back to the beginning with 3 different versions of the microservices:

kubectl delete -f samples/bookinfo/networking/virtual-service-all-v1.yaml

Cleanup

This wraps up all the basic functionality of Istio 1.0.0 that I wanted to show on GKE. To cleanup, let’s first delete the BookInfo app:

kubectl delete -f samples/bookinfo/networking/bookinfo-gateway.yaml
kubectl delete -f samples/bookinfo/platform/kube/bookinfo.yaml

Confirm that BookInfo app is gone:

kubectl get gateway
kubectl get virtualservices
kubectl get pods

Finally, cleanup Istio:

kubectl delete -f install/kubernetes/istio-demo.yaml

Confirm that Istio is gone:

kubectl get pods -n istio-system

Istio 101 (0.8.0) on GKE

In one of my previous posts, I showed how to install Istio on minikube and deploy the sample BookInfo app. A new Istio version is out (0.8.0) with a lot of changes, especially changes on traffic management, which made my steps in the previous post a little obsolete.

In this post, I want to show how to install Istio 0.8.0 on Google Kubernetes Engine (GKE), deploy the sample BookInfo app and show some of the add-ons and traffic routing.

Create Kubernetes cluster

First, we need a Kubernetes cluster to install Istio. On GKE, this is a single command:

gcloud container clusters create hello-istio \
 --cluster-version=latest \
 --zone europe-west1-b \
 --num-nodes 4

I’m using 4 worker nodes. That’s the recommended number of nodes for BookInfo sample.

Once the cluster is created, we also need to create a clusterrolebinding for Istio to be able to manage the cluster:

kubectl create clusterrolebinding cluster-admin-binding \
 --clusterrole=cluster-admin \
 --user=$(gcloud config get-value core/account)

Download & Setup Istio

Now that we have a cluster, let’s download the latest Istio (0.8.0 as of today):

curl -L https://git.io/getLatestIstio | ISTIO_VERSION=0.8.0 sh -

Add Istio’s command line tool istioctl to your PATH. We’ll need it later:

export PATH="$PATH:./istio-0.8.0/bin"

Install Istio

It’s time to install Istio with mutual authentication between sidecars:

kubectl apply -f install/kubernetes/istio-demo-auth.yaml

Once it’s done, you can check that pods are running under istio-system namespace:

kubectl get pods -n istio-system

You’ll realize that in addition to Istio base components (eg. pilot, mixer, ingress, egress), a number of add-ons are also installed (eg. prometheus, servicegraph, grafana). This is different from the previous versions of Istio.

Enable sidecar injection

When we configure and run the services, Envoy sidecars can be automatically injected into each pod for the service. For that to work, we need to enable sidecar injection for the namespace (‘default’) that we will use for our microservices. We do that by applying a label:

kubectl label namespace default istio-injection=enabled

And verify that label was successfully applied:

kubectl get namespace -L istio-injection

Deploy BookInfo app

Let’s deploy the BookInfo sample app now:

kubectl apply -f samples/bookinfo/kube/bookinfo.yaml

And make sure all the pods are running. Notice that there are 2 pods for each service (1 the actual service and 1 sidecar):

kubectl get pods

Deploy BookInfo Gateway

In Istio 0.8.0, traffic management completely changed and one of those changes is that you need to create a gateway for ingress traffic. Let’s go ahead and create a gateway for BookInfo app:

istioctl create -f samples/bookinfo/routing/bookinfo-gateway.yaml

Use BookInfo app

We can finally take a look at the app. We need to find ingress gateway IP and port:

kubectl get svc istio-ingressgateway -n istio-system

To make it easier for us, let’s define a GATEWAY_URL variable:

export INGRESS_HOST=$(kubectl -n istio-system get service istio-ingressgateway -o jsonpath='{.status.loadBalancer.ingress[0].ip}')
export INGRESS_PORT=$(kubectl -n istio-system get service istio-ingressgateway -o jsonpath='{.spec.ports[?(@.name=="http")].port}')
export GATEWAY_URL=$INGRESS_HOST:$INGRESS_PORT

Let’s see if the app is working. You should get 200 with curl:

curl -o /dev/null -s -w "%{http_code}\n" http://${GATEWAY_URL}/productpage

You can also open a browser and see the web frontend for product page. At this point, we got the app deployed and managed by a basic installation of Istio.

Next, we’ll take a look at some of the add-ons. Unlike previous versions, add-ons are automatically installed already. Let’s start sending some traffic first:

for i in {1..100}; do curl -o /dev/null -s -w "%{http_code}\n" http://${GATEWAY_URL}/productpage; done

Grafana dashboard

There’s Grafana for dashboarding. Let’s setup port forwarding first:

kubectl -n istio-system port-forward $(kubectl -n istio-system get pod -l app=grafana -o jsonpath='{.items[0].metadata.name}') 8080:3000

Navigate to http://localhost:8080 to see the dashboard:

Istio Dashboard in Grafana

Prometheus metrics

Next, let’s take a look at Prometheus for metrics. Set port forwarding:

kubectl -n istio-system port-forward $(kubectl -n istio-system get pod -l app=prometheus -o jsonpath='{.items[0].metadata.name}') 8083:9090

Navigate to http://localhost:8083/graph to see Prometheus:

Prometheus in Istio

ServiceGraph

For dependency visualization, we can take a look at ServiceGraph:

kubectl -n istio-system port-forward $(kubectl -n istio-system get pod -l app=servicegraph -o jsonpath='{.items[0].metadata.name}') 8082:8088

Navigate to http://localhost:8082/dotviz:

Screen Shot 2018-06-07 at 10.02.38 AM.png

Tracing

For HTTP tracing, there is Jaegar and Zipkin. Let’s take a look at Jaeger. Setup port forwarding as usual:

kubectl port-forward -n istio-system $(kubectl get pod -n istio-system -l app=jaeger -o jsonpath='{.items[0].metadata.name}') 8084:16686

Navigate to http://localhost:8084

Screen Shot 2018-06-07 at 10.05.11 AM

Traffic Management

Traffic Management changed dramatically in 0.8.0. You can read more about it here but basically instead of routing rules, we now have VirtualServices and DestinationRules.

You can see the existing VirtualServices and DestinationRules like this:

istioctl get virtualservices -o yaml
istioctl get destinationrules -o yaml

When you go to the product page of BookInfo application and do a browser refresh a few times, you will see that the reviews section on the right keeps changing (the stars change color). This is because there are 3 different reviews microservices and everytime, a different microservice is invoked. Let’s pin all microservices to version1:

istioctl create -f samples/bookinfo/routing/route-rule-all-v1-mtls.yaml

This creates VirtualServices and DestinationRules needed to pin all microservices to version1. Now, if you back to the product page and do a browser refresh, nothing changes because reviews microservice is pinned to version1 now.

To pin a specific user (eg. Jason) to a specific version (v2), we can do the following:

istioctl replace -f samples/bookinfo/routing/route-rule-reviews-test-v2.yaml

With this rule, if you login to the product page with username “Jason”, you should see the v2 version of reviews microservice.

To clean up all destination rules, run the following and now we’re back to the beginning with 3 different versions of the microservices:

istioctl delete -f samples/bookinfo/routing/route-rule-all-v1.yaml

Cleanup

This wraps up all the basic functionality of Istio 0.8.0 that I wanted to show on GKE. To cleanup, let’s first delete the BookInfo app:

samples/bookinfo/kube/cleanup.sh

Confirm that BookInfo app is gone:

istioctl get gateway
istioctl get virtualservices
kubectl get pods

Finally, cleanup Istio:

kubectl delete -f install/kubernetes/istio-demo.yaml

Confirm that Istio is gone:

kubectl get pods -n istio-system

Codemotion in Amsterdam, Devoxx in London

After my trip in Istanbul, I visited my parents in Nicosia, Cyprus for a long weekend. Then, I stopped by in Amsterdam for Codemotion before coming back to London for Devoxx. 4 cities in 4 countries in 1 week was exhausting but also a lot of fun in many ways.

Codemotion Amsterdam

Amsterdam is almost a second home to me nowadays. There’s a great tech scene and a lot of tech events throughout the year, as a result, I end up visiting Amsterdam at least 2-3 times a year.

Codemotion is a European tech conference that happens in many locations. As you might remember, I spoke at Codemotion Rome earlier this year (trip report). This was my second time speaking at Codemotion Amsterdam. Last year, I spoke about gRPC and this year about Istio, both open source projects .

Codemotion Amsterdam is a mid-size conference, my guess is about 1000/1500 developers. I love the venue of Codemotion Amsterdam. It’s in an old factory kind of place, right next to the river. They did a great job with the venue decoration, lighting both last year and this year as well.

Talk & Questions

I did my usual Istio 101 talk to a group of about 100 developers. After my talk, I got the following questions:

  • How does Istio compare to Conduit? (apparently, Conduit is an Istio like project but I didn’t know much about it).
  • How can we have sticky sessions with Istio? (i.e. make sure certain users always go to the same pod).
  • Is it possible to have a message queue between services? This is a common pattern in microservices and a couple of people were wondering if this is possible in Istio.

Devoxx London

After Amsterdam, I arrived back to London for Devoxx UK. Even though I’m based in London, I don’t get to speak as much as I’d like in London, mainly due to my travels, so I was happy to be part of Devoxx UK.

Devoxx is another European conference that happens in places like Brussels, Krakow, Casablanca and London. It started as a Java conference but nowadays, it’s much more than just Java. I got to speak at Devoxx Brussels, Krakow and Casablanca in previous years but this was my first time speaking in Devoxx London.

As a side note, Devoxx Brussels is one of the best tech conferences I ever attended with great technical content, huge cinema like screens for previous and awesome attendees and speakers. In comparison, London is smaller but still a nice conference.

Talk & Questions

In Devoxx London, I did my Istio 101 talk again. It’s great to see so much interest in Istio from the community. The talk of the video is already online, so you can watch it here if you like:

After the talk, I got the following questions:

  • Kafka or some message queue between services: Again, people are curious about how to have an async architecture with message queues between services.
  • Zipkin add-on: Where does it save its data? If Istio is restarted, does the data persist?
  • Zipkin: Can we have it to look at our custom headers for tracing?
  • Pilot stability: What happens if Pilot does? Does the service mesh still work? Does Pilot’s state persist somewhere?