This is a quick note to let you know that I’m now blogging on my platform at atamel.dev. Please follow me there if you want to stay up to date.
Migrating from Knative Build to Tekton Pipelines
Knative 0.8.0 and Build Deprecation
Knative 0.8.0 came out a couple of weeks ago with a number of fixes and improvements. One of the biggest changes in 0.8.0 is that Knative Build is now deprecated according to docs:

Knative Installation docs also only include Knative Serving and Eventing without mentioning Build:
kubectl apply
-f https://github.com/knative/serving/releases/download/v0.8.0/serving.yaml \
-f https://github.com/knative/eventing/releases/download/v0.8.0/release.yaml \
-f https://github.com/knative/serving/releases/download/v0.8.0/monitoring.yaml
Good to know but there’s no explanation on why Knative Build was deprecated and any guidance on what is the replacement, if any. After a little bit of research, I have more information on deprecation and also a migration path that I’d like to share in this post.
There’s a Knative issue (614) with more details but basically, it has been decided that building and pushing an image for a service should not be one of the core responsibilities for Knative.
Instead, Knative users can rely on a number of other better tools. One of those tools is called Tekton Pipelines. Inspired by Knative Build, The Tekton Pipelines project provides Kubernetes style resources for declaring CI/CD-style pipelines. It does everything Knative Build does and some more.
Hello Tekton Pipelines
In Tekton Pipelines, you can create a simple one-off tasks or more complicated CI/CD pipelines. There are 4 main primitives for Tekton Pipelines:
- Task defines the work that needs to be executed with 1 or more steps.
- PipelineResources defines the artifacts that can be passed in and out of a task.
- TaskRun runs the Task you defined with the supplied resources.
- Pipeline defines a list of tasks to execute in order.
Before you can use Tekton Pipelines, you need to install it in your Kubernetes cluster. Detailed instructions are here but it’s as easy as:
kubectl apply -f https://storage.googleapis.com/tekton-releases/latest/release.yaml
Once you have it installed, you can check the Tekton pods:
kubectl get pods -n tekton-pipelines

NAME                                           READY   STATUS
tekton-pipelines-controller-55c6b5b9f6-8p749   1/1     Running
tekton-pipelines-webhook-6794d5bcc8-pf5x7      1/1     Running
Knative Build ==> Tekton Pipelines
There’s basic documentation on Migrating from Knative Build to Tekton. In a nutshell, these are Tekton equivalents of Knative Build constructs:
| Knative | Tekton |
| Build | TaskRun |
| BuildTemplate | Task |
| ClusterBuildTemplate | ClusterTask |
Additionally, the Tekton Catalog aims to provide a catalog of re-usable Tasks, similar to what Knative BuildTemplate repository used to do before.
Build with Kaniko Task
As an example, let’s take a look at how to build and push an image to Google Container Registry (GCR) using Tekton Pipelines.
In Tekton world, you start with either defining your custom Task (example) or re-using someone else’s Task (example). Let’s use the Kaniko Task already available on Tekton Catalog.
First, install the Kaniko Task and make sure it’s installed:
kubectl apply -f https://raw.githubusercontent.com/tektoncd/catalog/master/kaniko/kaniko.yaml

kubectl get task

NAME     AGE
kaniko   45m
Second, define a TaskRun to use the Task and supply the required parameters:
apiVersion: tekton.dev/v1alpha1
kind: TaskRun
metadata:
  name: build-kaniko-helloworld-gcr
spec:
  taskRef:
    name: kaniko
  inputs:
    resources:
    - name: source
      resourceSpec:
        type: git
        params:
        - name: url
          value: https://github.com/meteatamel/knative-tutorial
    params:
    - name: DOCKERFILE
      value: Dockerfile
    - name: CONTEXT
      value: serving/helloworld/csharp
  outputs:
    resources:
    - name: image
      resourceSpec:
        type: image
        params:
        - name: url
          # Replace {PROJECT_ID} with your GCP Project's ID.
          value: gcr.io/{PROJECT_ID}/helloworld:kaniko-tekton
Finally, start the TaskRun and check that it’s succeeded:
kubectl apply -f taskrun-build-kaniko-helloworld-gcr.yaml

kubectl get taskrun

NAME                          SUCCEEDED
build-kaniko-helloworld-gcr   True
At this point, you should see the container image built and pushed to GCR.
Hopefully, this blog post provided you the basics needed to move from Knative Build to Tekton Pipeliens. I also updated my Knative Tutorial for the 0.8.0 release. Check it out for more examples of converting Knative Build to Tekton Pipelines:

Migrating from Kubernetes Deployment to Knative Serving
When I talk about Knative, I often get questions on how to migrate an app from Kubernetes Deployment (sometimes with Istio) to Knative and what are the differences between the two setups.
First of all, everything you can do with a Knative Service, you can probably do with a pure Kubernetes + Istio setup and the right configuration. However, it’ll be much harder to get right. The whole point of Knative is to simplify and abstract away the details of Kubernetes and Istio for you.
In this blog post, I want to answer the question in a different way. I want to start with a Knative Service and show how to setup the same service with Kubernetes + Istio the ‘hard way’.
Knative Service
In my previous post, I showed how to deploy an autoscaled, gRPC enabled, ASP.NET Core service with Knative. This was the Knative service definition yaml file:
apiVersion: serving.knative.dev/v1beta1
kind: Service
metadata:
  name: grpc-greeter
  namespace: default
spec:
  template:
    spec:
      containers:
        - image: docker.io/meteatamel/grpc-greeter:v1
          ports:
          - name: h2c
            containerPort: 8080
Notice the simplicity of the yaml file. It had the container image and the port info (HTTP2/8080) and not much else. Once deployed, Knative Serving took care of all the details of deploying the container in a Kubernetes pod, exposing that pod to the outside world via Istio ingress and also setting up autoscaling.
What does it take to deploy the same service in a Kubernetes + Istio cluster without Knative? Let’s take a look.
Kubernetes Deployment
First, we need a Kubernetes Deployment to encapsulate the container in a pod. This is how the deployment yaml looks like:
apiVersion: apps/v1
kind: Deployment
metadata:
  name: grpc-greeter
spec:
  selector:
      matchLabels:
        app: grpc-greeter
  template:
    metadata:
      labels:
        app: grpc-greeter
    spec:
      containers:
      - name: grpc-greeter
        image: docker.io/meteatamel/grpc-greeter:v1
        ports:
        - name: h2c
          containerPort: 8080
This is already more verbose than a Knative service definition. Once deployed, we’ll have a pod running the container.
Kubernetes Service
Next step is to expose the pod behind a Kubernetes Service:
apiVersion: v1
kind: Service
metadata:
  name: grpc-greeter-service
spec:
  ports:
  - name: http2
    port: 80
    targetPort: h2c
  selector:
    app: grpc-greeter
This will expose the pod behind port 80. However, it’s not publicly accessible yet until we setup networking in Istio.
Istio Gateway and VirtualService
In an Istio cluster, we need to first setup a Gateway to enable external traffic on a port/protocol. In our case, our app requires HTTP on port 80. This is the Gateway definition we need:
apiVersion: networking.istio.io/v1alpha3
kind: Gateway
metadata:
  name: grpc-gateway
spec:
  selector:
    istio: ingressgateway # use istio default controller
  servers:
  - port:
      number: 80
      name: http
      protocol: HTTP
    hosts:
    - "*"
We now have traffic enabled on port 80 but we need to map the traffic to the Kubernetes Service we created earlier. That’s done via a VirtualService:
apiVersion: networking.istio.io/v1alpha3
kind: VirtualService
metadata:
  name: grpc-virtualservice
spec:
  hosts:
  - "*"
  gateways:
  - grpc-gateway
  http:
  - route:
    - destination:
        host: grpc-greeter-service
Our pod is finally publicly accessible. You can use the GrpcGreeterClient from my previous blog to point to the Istio Ingress Gateway IP and you should see a response from our service:
> dotnet run
Greeting: Hello GreeterClient
Press any key to exit…
Phew! A lot of steps to deploy a publicly accessible container without Knative. We still need to setup autoscaling of pods to get parity with Knative Serving but I’ll leave that as an exercise to the reader.
I hope it’s clear now that Knative makes it easier to deploy autoscaled containers with much less configuration. Knative’s higher level APIs allow you to focus more on your code in a container than the underlying details of how that container is deployed and how its traffic is managed with Kubernetes and Istio.
Thanks to Matt Moore from the Knative team for giving me the idea for the blog post.
Serverless gRPC + ASP.NET Core with Knative
I was recently going through the ASP.NET Core updates in .NET Core 3.0 Preview 3 post, this section got my attention: gRPC template.
Apparently, .NET Core 3.0 got a new gRPC template for easily building gRPC services with ASP.NET Core. I tested gRPC and .NET before and I have some samples in my grpc-samples-dotnet repo. Even though gRPC and .NET worked before, it wasn’t that straightforward to setup. I was curious to try out the new gRPC template and see how it helped.
Additionally, I wanted to go beyond a simple gRPC service and see what it takes to turn it into a serverless Knative service with all the benefits of Knative such as autoscaling, revisions, etc.
If you want to try this out yourself, I have a new section in my Knative tutorial: Serverless gRPC with Knative with detailed instructions. In this blog post, I want to highlight some of the main steps for a serverless, gRPC enabled, ASP.NET Core service deployed to Knative on Google Kubernetes Engine (GKE).
Create a gRPC service with the new template
Creating a HelloWorld gRPC service with .NET Core 3.0 couldn’t be any simpler with the gRPC template. This is the command:
> dotnet new grpc -o GrpcGreeter
This command does a few things in the background:
- Creates an ASP.NET Core project with all gRPC dependencies already included.
- Creates a gRPC service definition file named
greet.proto. - Auto-generates all gRPC stubs based on the service definition file.
- Creates a gRPC service (
GreeterService.cs) based on the auto-generated gRPC stub. - Configures the gRPC pipeline in
Startup.csto map toGreeterService.cs
The end result is that you have all of gRPC details taken care of and you can simply start running the service:
> dotnet run
info: Microsoft.Hosting.Lifetime[0]
      Now listening on: http://localhost:50051
This is much simpler than what I had to before. Great job from the .NET Core team!
Containerize the gRPC service
Next step is to containerize the gRPC service, so it can be deployed to Knative. The Dockerfile looks something like this:
FROM mcr.microsoft.com/dotnet/core/sdk:3.0

WORKDIR /app
COPY *.csproj .
RUN dotnet restore

COPY . .

RUN dotnet publish -c Release -o out

ENV PORT 8080

ENV ASPNETCORE_URLS http://*:${PORT}

CMD ["dotnet", "out/GrpcGreeter.dll"]
I’m using .NET Core 3.0 as the base image and making sure that the service runs on port 8080, instead of the default gRPC port 50051. Nothing special.
Deploy the Knative service
Once the image is built and pushed, define the Knative service in a service.yamlfile:
apiVersion: serving.knative.dev/v1beta1
kind: Service
metadata:
  name: grpc-greeter
  namespace: default
spec:
  template:
    spec:
      containers:
        # Replace {username} with your actual DockerHub
        - image: docker.io/{username}/grpc-greeter:v1
          ports:
          - name: h2c
            containerPort: 8080
This is a plain Knative service definition pointing to the image. The only special part is the ports section where we define a h2c port 8080. This tells Knative that container is expecting HTTP/2 traffic on port 8080.
Deploy the Knative service:
> kubectl apply -f service.yaml
Make sure that a pod with gRPC service is running:
> kubectl get pods

NAME
grpc-greeter-5tpwl-deployment-6fb423289c5-r5qmt
Test it out
To test out the gRPC service, you need the corresponding gRPC enabled client. You can refer to Create a gRPC client part of my tutorial on how to create a GrpcGreeterClient.cs. Once you have the client, just point to your Knative service. You should see a reply from the gRPC service running in Knative:
> dotnet run

Greeting: Hello GreeterClient
Press any key to exit...
On the surface, this looks like the response you’d get from a plain gRPC service. However, it’s a Knative managed service, meaning you have 0-n automatic scaling, revisions and all other benefits of running a service in Knative.
.NET Core 3.0 makes it really easy to get started with gRPC and Knative transforms plain gRPC into serverless-style services that autoscale and respond to events. This is a powerful combination and hopefully this blog post and the corresponding tutorial gave you a glimpse of how to use .NET Core with gRPC and Knative.
Application metrics in Istio
Background
The default metrics sent by Istio are useful to get an idea on how the traffic flows in your cluster. However, to understand how your application behaves, you also need application metrics.
Prometheus has client libraries that you can use to instrument your application and send those metrics. This is good but it raises some questions:
- Where do you collect those metrics?
- Do you use Istio’s Prometheus or set up your own Prometheus?
- If you use Istio’s Prometheus, what configuration do you need to get those metrics scraped?
Let’s try to answer these questions.
Istio vs. standalone Prometheus
In Prometheus, there’s a federation feature that allows a Prometheus server to scrape metrics from another Prometheus server. If you want to keep Istio metrics and application metrics separate, you can set up a separate Prometheus server for application metrics. Then, you can use federation to scrape those application metrics scraped with Istio’s Prometheus server.
A simpler approach is to scrape the application’s metrics using Istio’s Prometheus directly and that’s what I want to focus on here.
Sending application metrics
To send custom metrics from your application, you need to instrument your application using Prometheus’ client libraries. Which library to use depends on the language you’re using. As a C#/.NET developer, I used the .NET client for Prometheus and this blog post from Daniel Oliver has step-by-step instructions on how to send custom metrics from an ASP.NET Core application and see them in a local Prometheus server.
One thing you need to pay attention to is the port where you’re exposing your Prometheus metrics. In ASP.NETCore, the default port is 5000. When running locally, application metrics are exposed on localhost:5000/metrics. However, when you containerize your app, it’s common to expose your application over a different port, like 8080, and this becomes relevant later when we talk about configuration.
Assuming that you containerized and deployed your application on an Istio-enabled Kubernetes cluster, let’s now take a look at what we need to do to get these application metrics scraped by Istio’s Prometheus.
Configuration
In Istio 1.0.5, the default installation files for Kubernetes, istio-demo.yaml or istio-demo-auth.yaml, already have scraping configurations for Prometheus under a ConfigMap. You can just search for prometheus.yml. There are 2 scraping jobs that are relevant for application metrics:
- job_name: 'kubernetes-pods'
  kubernetes_sd_configs:
- role: pod
...
- job_name: 'kubernetes-pods-istio-secure'
  scheme: https
These are the jobs that scrape metrics from regular pods and pods where mTLS is enabled. It looks like Istio’s Prometheus should automatically scrape application metrics. However, in my first try, it didn’t work. I wasn’t sure what was wrong but Prometheus has some default endpoints:
/config: to see the current configuration of Prometheus./metrics: to see the scraped metrics./targets: to see the targets that’s being scraped and their status.
All of these endpoints are useful for debugging Prometheus:
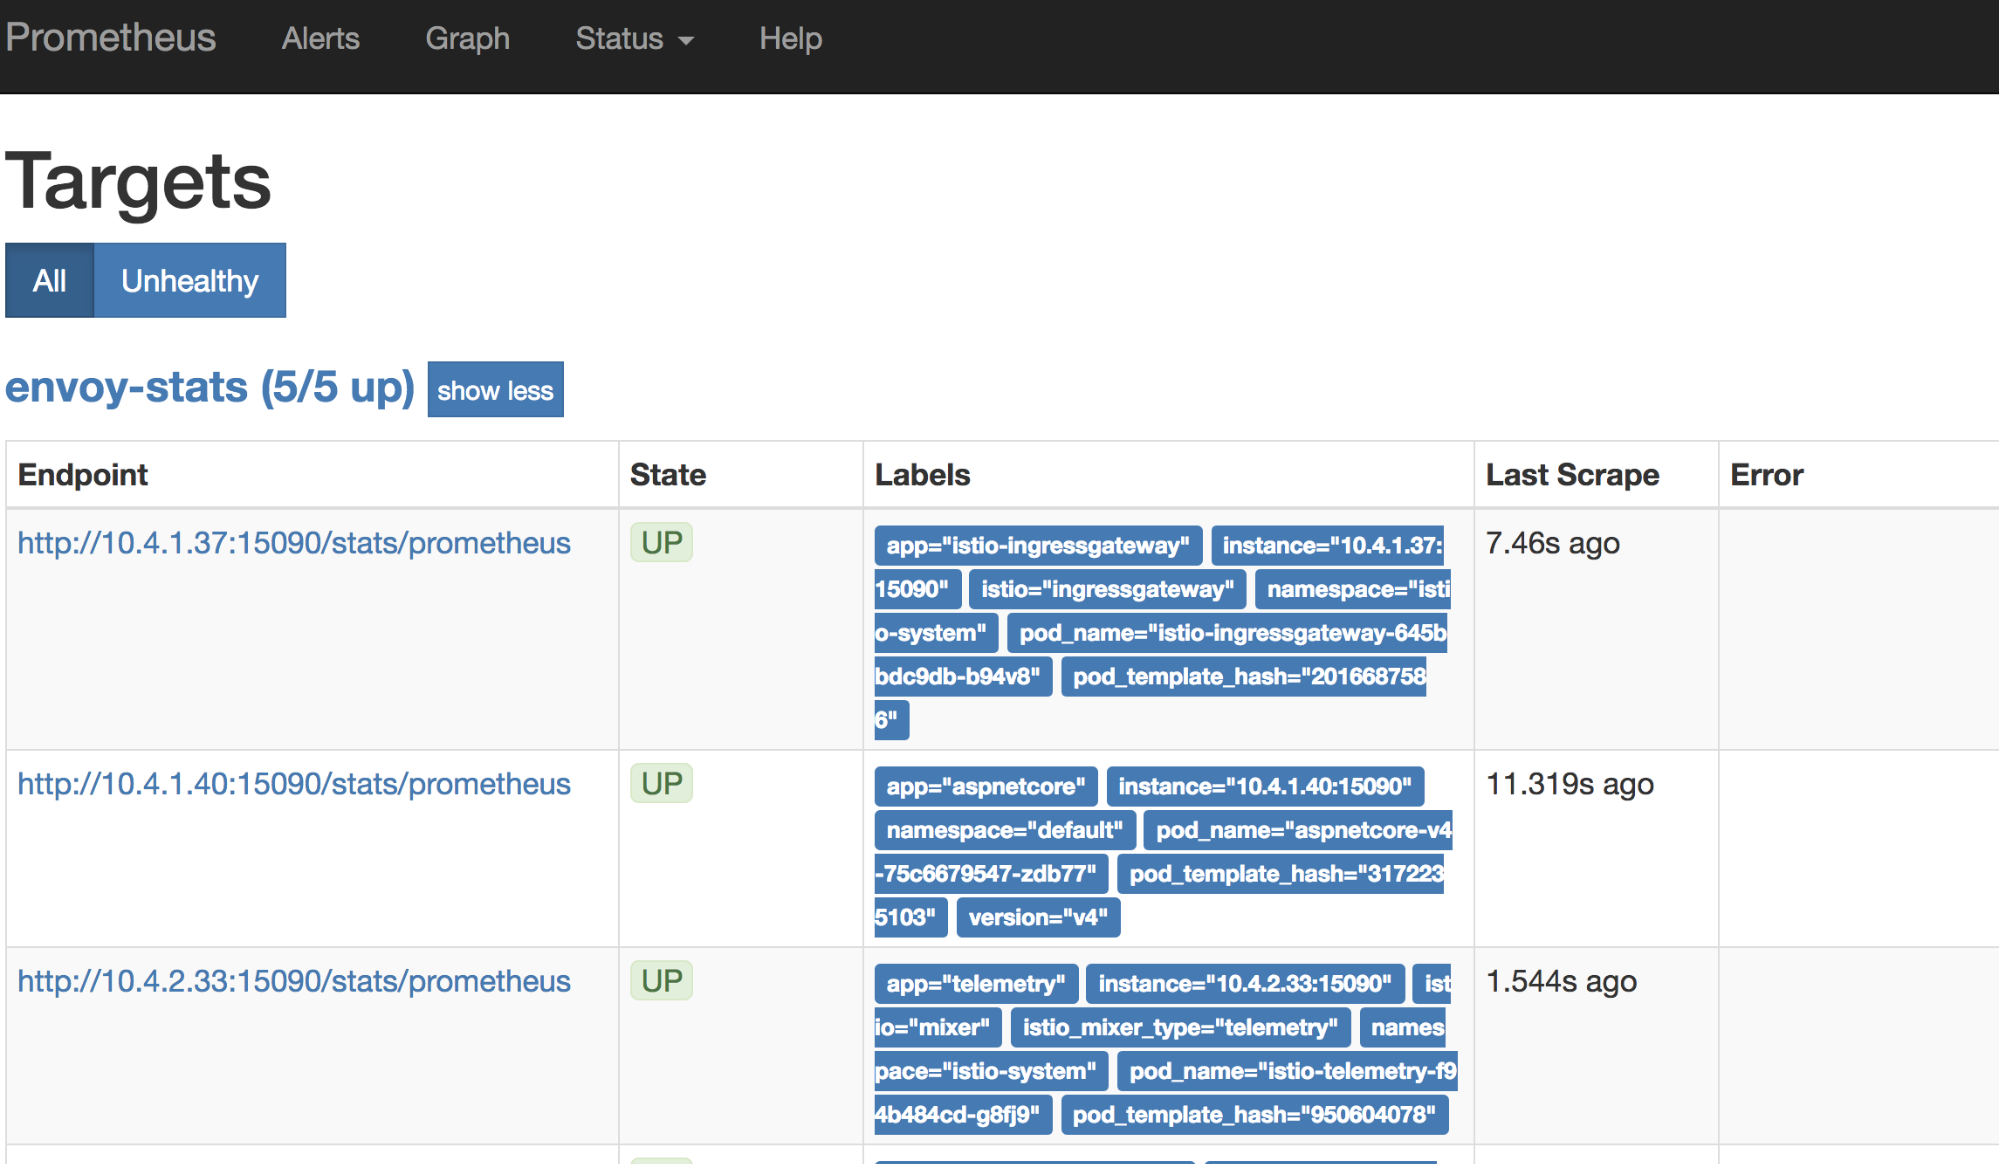
Turns out, I needed to add some annotations in my pod YAML files in order to get Prometheus scrape the pod. I had to tell Prometheus to scrape the pod and on which port with these annotations:
kind: Deployment
metadata:
  name: aspnetcore-v4
spec:
  replicas: 1
  template:
    metadata:
      labels:
        app: aspnetcore
        version: v4
      annotations:
        prometheus.io/scrape: "true"
        prometheus.io/port: "8080"
After adding the annotations, I was able to see my application’s metrics in Prometheus:
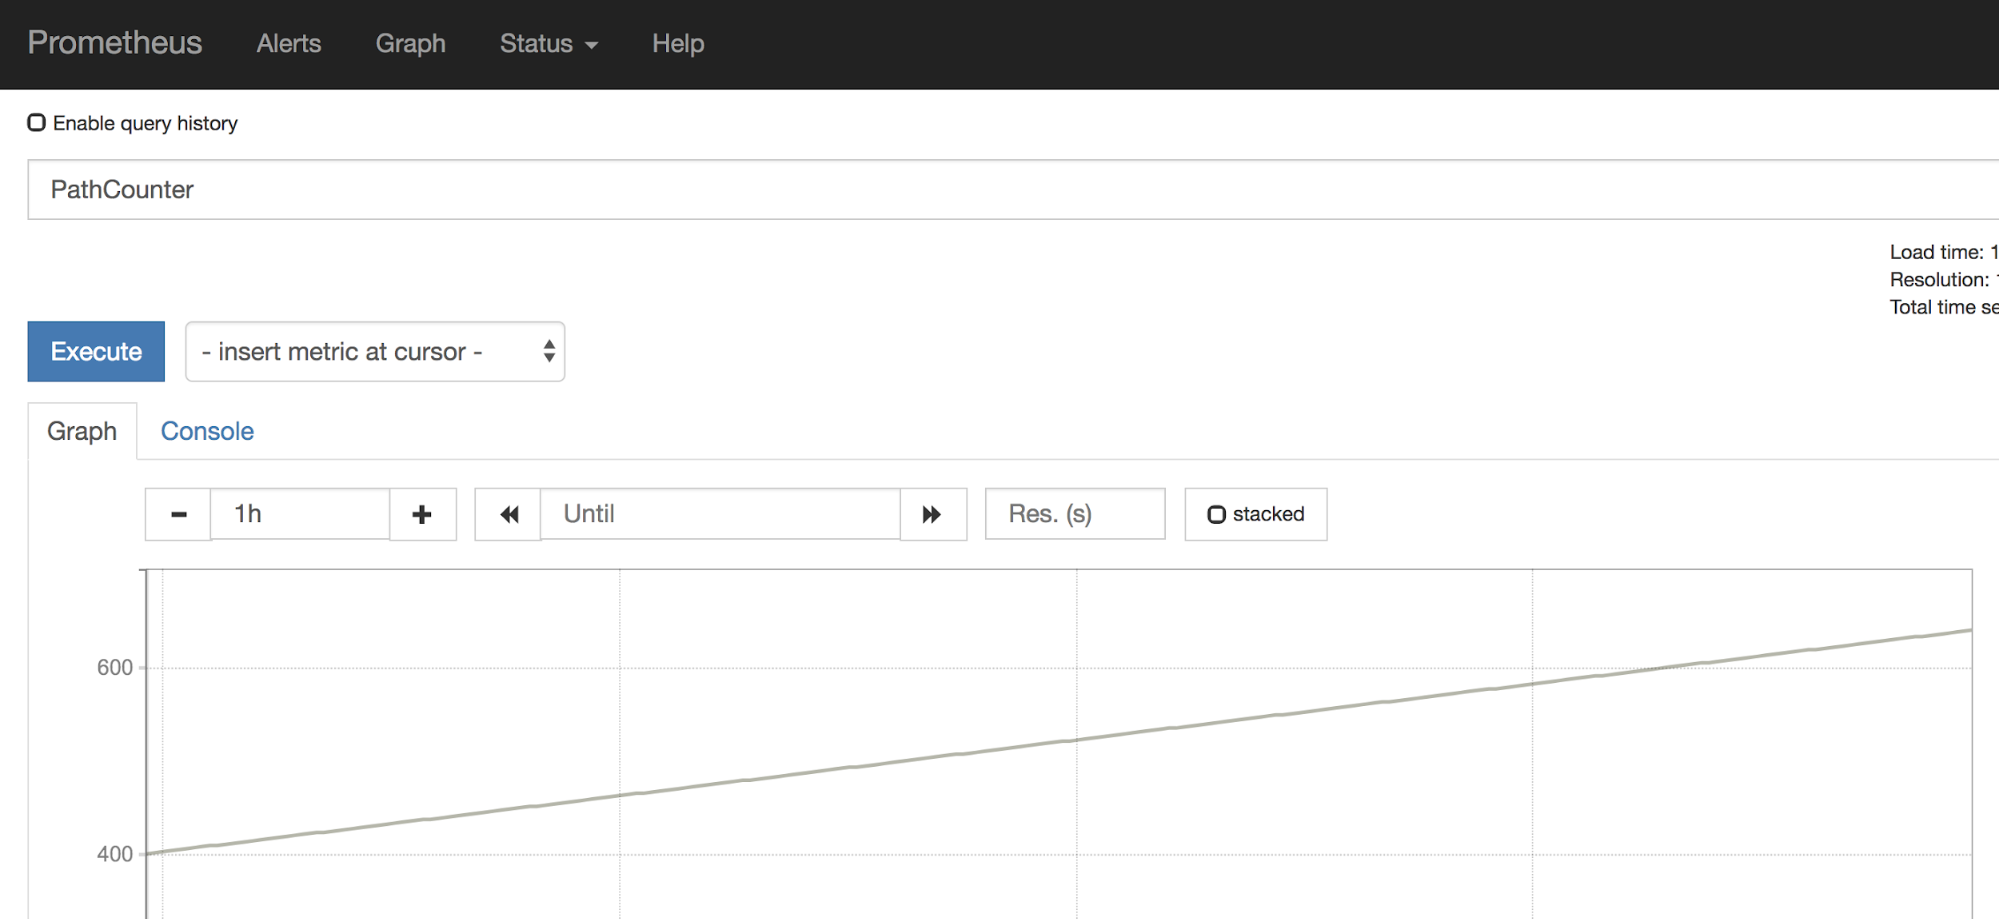
However, it was only working for regular pods and I was not able to see metrics with mTLS enabled between pods.
Issue with Istio certs and Prometheus
After some investigation, I contacted the Istio team and turns out, there’s a bug. When Prometheus starts, it will attempt to mount the Istio-supplied certificates. However, they may not have been issued by Istio Citadel yet. Unfortunately, Prometheus does not retry to load the certificates, which leads to an issue scraping mTLS-protected endpoints.
It’s not ideal but there’s an easy workaround: restart the Prometheus pod. Restart forces Prometheus to pick up certificates and the application’s metrics start flowing for mTLS enabled pods as well.
Conclusion
Getting application metrics scraped by Istio’s Prometheus is pretty straightforward once you understand the basics. Hopefully, this post provided you the background info and configuration you need to achieve that.
It’s worth noting that Mixer is being redesigned and, in future versions of Istio, it will be directly embedded in Envoy. In that design, you’ll be able to send application metrics through Mixer and it’ll flow through the same overall metrics pipeline of the sidecar. This should make it simpler to get application metrics working end to end.
Thanks to the Istio team and my coworker Sandeep Dinesh for helping me to debug through issues, as I got things working.
